The Problem
Here at Valor Software we had the challenge of analyzing some metrics from developers productivity. So, we’ve started questioning ourselves: What are the core daily activities of a developer? On a macro level we could say that is to deliver clean and reliable code on top of a consistent base, but with which commit frequency? And how to correlate code deployment with bugs and other stuff? Is this related to teams, to specific projects or even to the used technology stack?
In Data Science, we usually start our investigations based on the scientific method (and CRISP-DM approach), to know better the target situation, its surroundings and mainly doing the questions that will drive us to catch the root cause of our problems.
OK, so much fancy stuff. What is the relationship between all of this and the Valor Software Medusa project? We realized that GitHub is a good provider of data when it comes to developers productivity as we can track information about repositories, commits, tests and much more, this drove us to develop a Data Pipeline to extract and process data from it.
The Solution
We have designed a business framework containing the daily core activities of a developer and have splitted it into four Pilars, when it comes to GitHub:
Version Control ManagementCompatibilityInfrastructureTeam
The problem organization is a very important step in Data Science/Engineering projects as it gives us the direction of what data sources we should consume what metrics we are willing to build, as makes no sense to build a rocket dashboard, having metrics that are not related to the operation.
How it was built
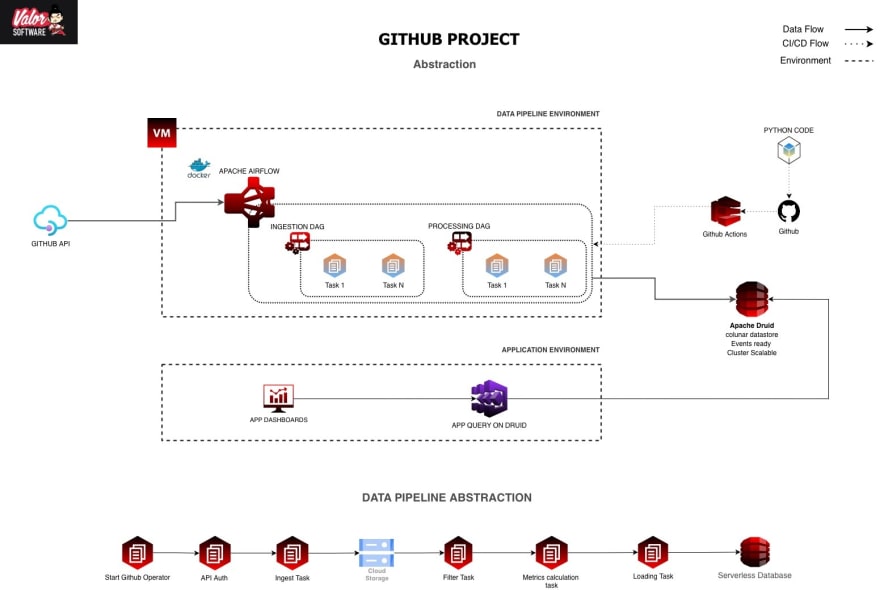
The idea is based in hitting the GitHub API, collecting the necessary metrics from a range of endpoints, saving the result in an intermediary layer and than load it to the DataBase.
Why do we use an intermediary layer rather than saving it directly to the DataBase?
We usually follow this approach in order to make the pipeline more resilient. Imagine we spent hours iterating over API pagination, and than some error occurs. In some cases we can suffer data loss and have to restart it all again. Saving the data in an intermediary layer such as AWS S3 or Google Storage makes the pipeline to execute in steps, and also allows us to process the data later, use it in Data Science experiments and so on.
The application design is based on OOP and contains the following mechanisms:
App DeploymentPipeline orchestrationStorage layerVisualization layerInfrastructure managementData pipeline source code
App deployment
The application deployment is done using Docker and the containers needed to run Airflow with its services are all described in a docker-compose file
Pipeline Orchestration
The triggering of the data ingestion and processing jobs can be done throughout the Airflow UI, which uses DAGs to manage all the working code (DAGs stands by Direct Acyclic Graphs and are responsible for managing the tasks of the data pipeline)
Storage Layers
There are two of them in this project. One is the intermediary layer, that stores the raw data from the API calls, organizing it into year/month/day of the request. The other one is the Data warehouse, a database based on PostgreSQL to store the tables containing the processed information.
Visualization layer
The chosen app for visualizing data at our data warehouse is Apache Superset. Considering it is free, Superset is an incredible tool. From my experience it has most of the features we can find in the famous and paid Power BI. In addition, Superset is also ready for streaming needs and is cluster scalable.
Infrastructure management
The infra is deployed at the Google Cloud, and the necessary resources are created and managed by Terraform
Data pipeline source code
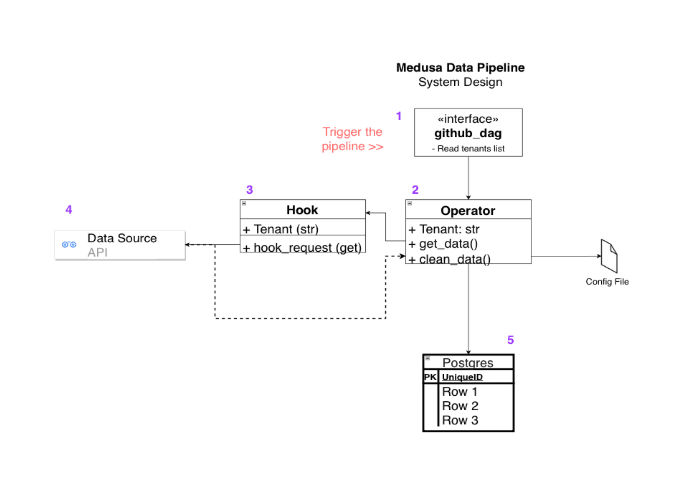
The code design is based on two strong objects which are intended to interact with each other so as to ingest, process and write data from different data sources to different destinations, all based on json configuration files.
- Hook: Responsible for interface with external services, like the GitHub API, the Cloud storage (GCP) and the Data warehouse, holding its credentials and authentication methods.
- Operator: Responsible for different methods operation (call) on top of the data and trigger functions like:
Download dataFilter dataCalculate metricsUpload logs
also holding configurations, restrictions and other information about the data object that is being ingested.
For the specific case of GitHub, the authentication is done using the account token. It can be a User or an Organization, resulting in a flexible object as User and Organizations have different API calls to retrieve similar categories of data. Just like in the representation bellow:

Once the data is requested from the API, based on the configuration file, it is stored in Google Cloud Storage. Once the data is properly downloaded to this intermediary layer, the Operator calls the configuration file to filter the correct information from the raw data, opening a way to the next step: data transformation, and metrics calculation.
Conclusion
The creation of data pipelines can become something really complex if we do not care about details like the creation of generic functions, the config files approach, as per reuse code and make the processing more flexible.
So, at the end we have a data warehouse to consume data, making it available to the Medusa App and to the dashboard tool. This way, managers, product managers or PO’s can create their own views, test their hypothesis or even find answers with the power of the data.
View of the data pipeline architecture:


