At Valor Software, we, with the help of generous contributors, developed a set of open source projects, that allow developers to build apps quicker and more qualitative. This should be helpful for other software development companies, yeah. Also, we put a lot of effort into experimenting with automated testing to make sure that those libraries work properly. That’s why now we’ll take a deep dive into our next experiment: testing <canvas> HTML elements.
Project description
ng2-charts is a small library that contains Angular directives and provides the possibility to integrate a number of types of charts: line, bar, radar, pie, polarArea, doughnut, bubble, and scatter.
Source data
There are no UI/E2E tests at all. We only have a small number of unit tests out there.
Goal
Quickly create the scope of UI or E2E tests to check basic charts on the Demo site.
Problems
Creating scope of tests for Demo site might not seem like a complex task, because Demo site contains only a few pages, but let’s look a b-i-it deeper:

Well, we have a single HTML element, which consists of graphic elements, and yeah it’s the <canvas>.
FYI, according to MDN:
canvas is an HTML element which can be used to draw graphics via scripting (usually JavaScript). This can, for instance, be used to draw graphs, combine photos, or create simple (and not so simple) animations…
That means we can interact with elements using nothing but an imitation of mouse actions. Since our goal is to check for the standard basic functionality, image comparison should be enough.
Implementation step 1. Testing main page with Cypress
describe('Main Page', () => {
    it(`navigate to main Demo page and check info`, () => {
     const topBarSelector = 'mat-toolbar';
     const mainContentSelector = 'main';
     cy.visit(''); cy.get(topBarSelector).should('be.visible')
      .eyesOpen({
       appName: 'NG2-charts',
       testName: `NG2-charts Main Page Top Bar`,
       browser: browsers
      })
      .eyesCheckWindow({
       sizeMode: 'selector',
       selector: topBarSelector,
       sendDom: false,
      })
      .eyesClose(); cy.get(mainContentSelector).should('be.visible')
      .eyesOpen({
       appName: 'NG2-charts',
       testName: `NG2-charts Main Page Content`,
       browser: browsers
      })
      .eyesCheckWindow({
       sizeMode: 'selector',
       selector: mainContentSelector,
       sendDom: false,
      })
      .eyesClose();
    });
});
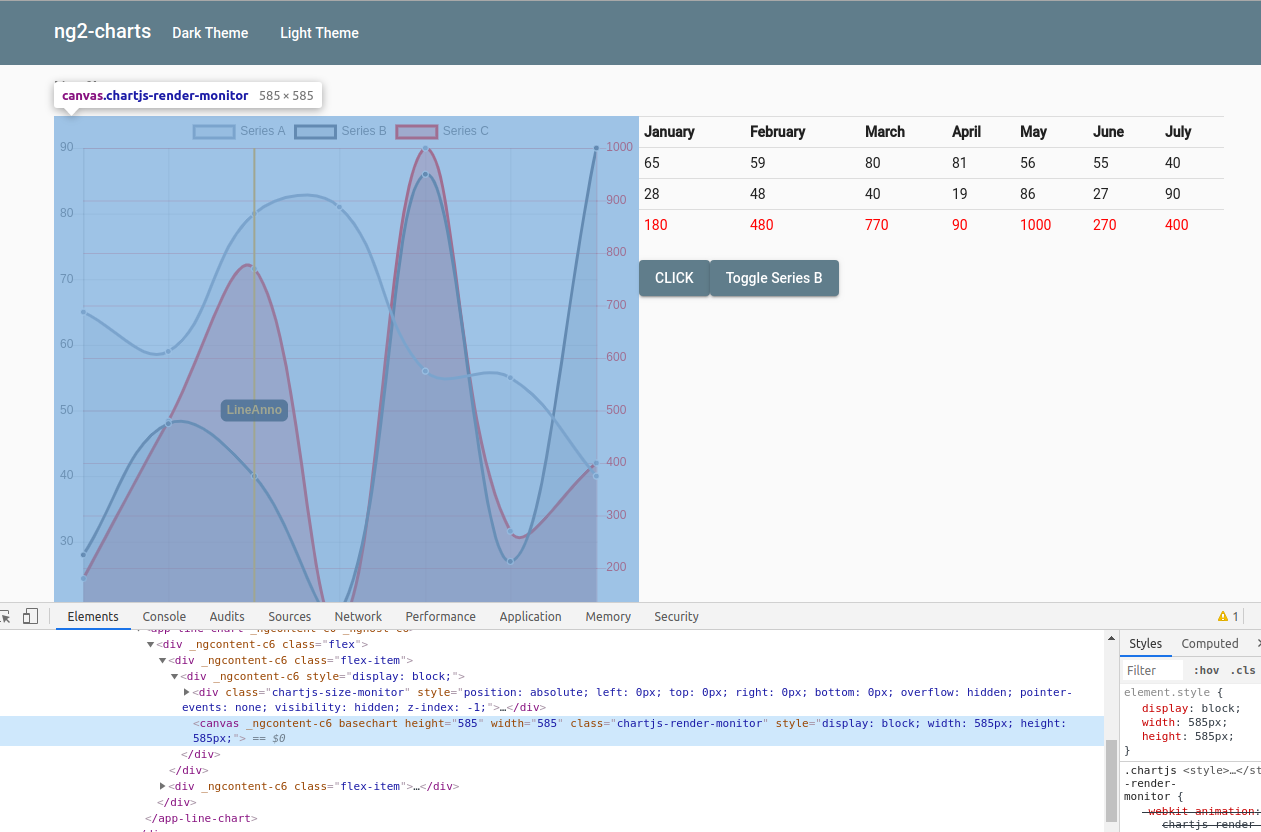
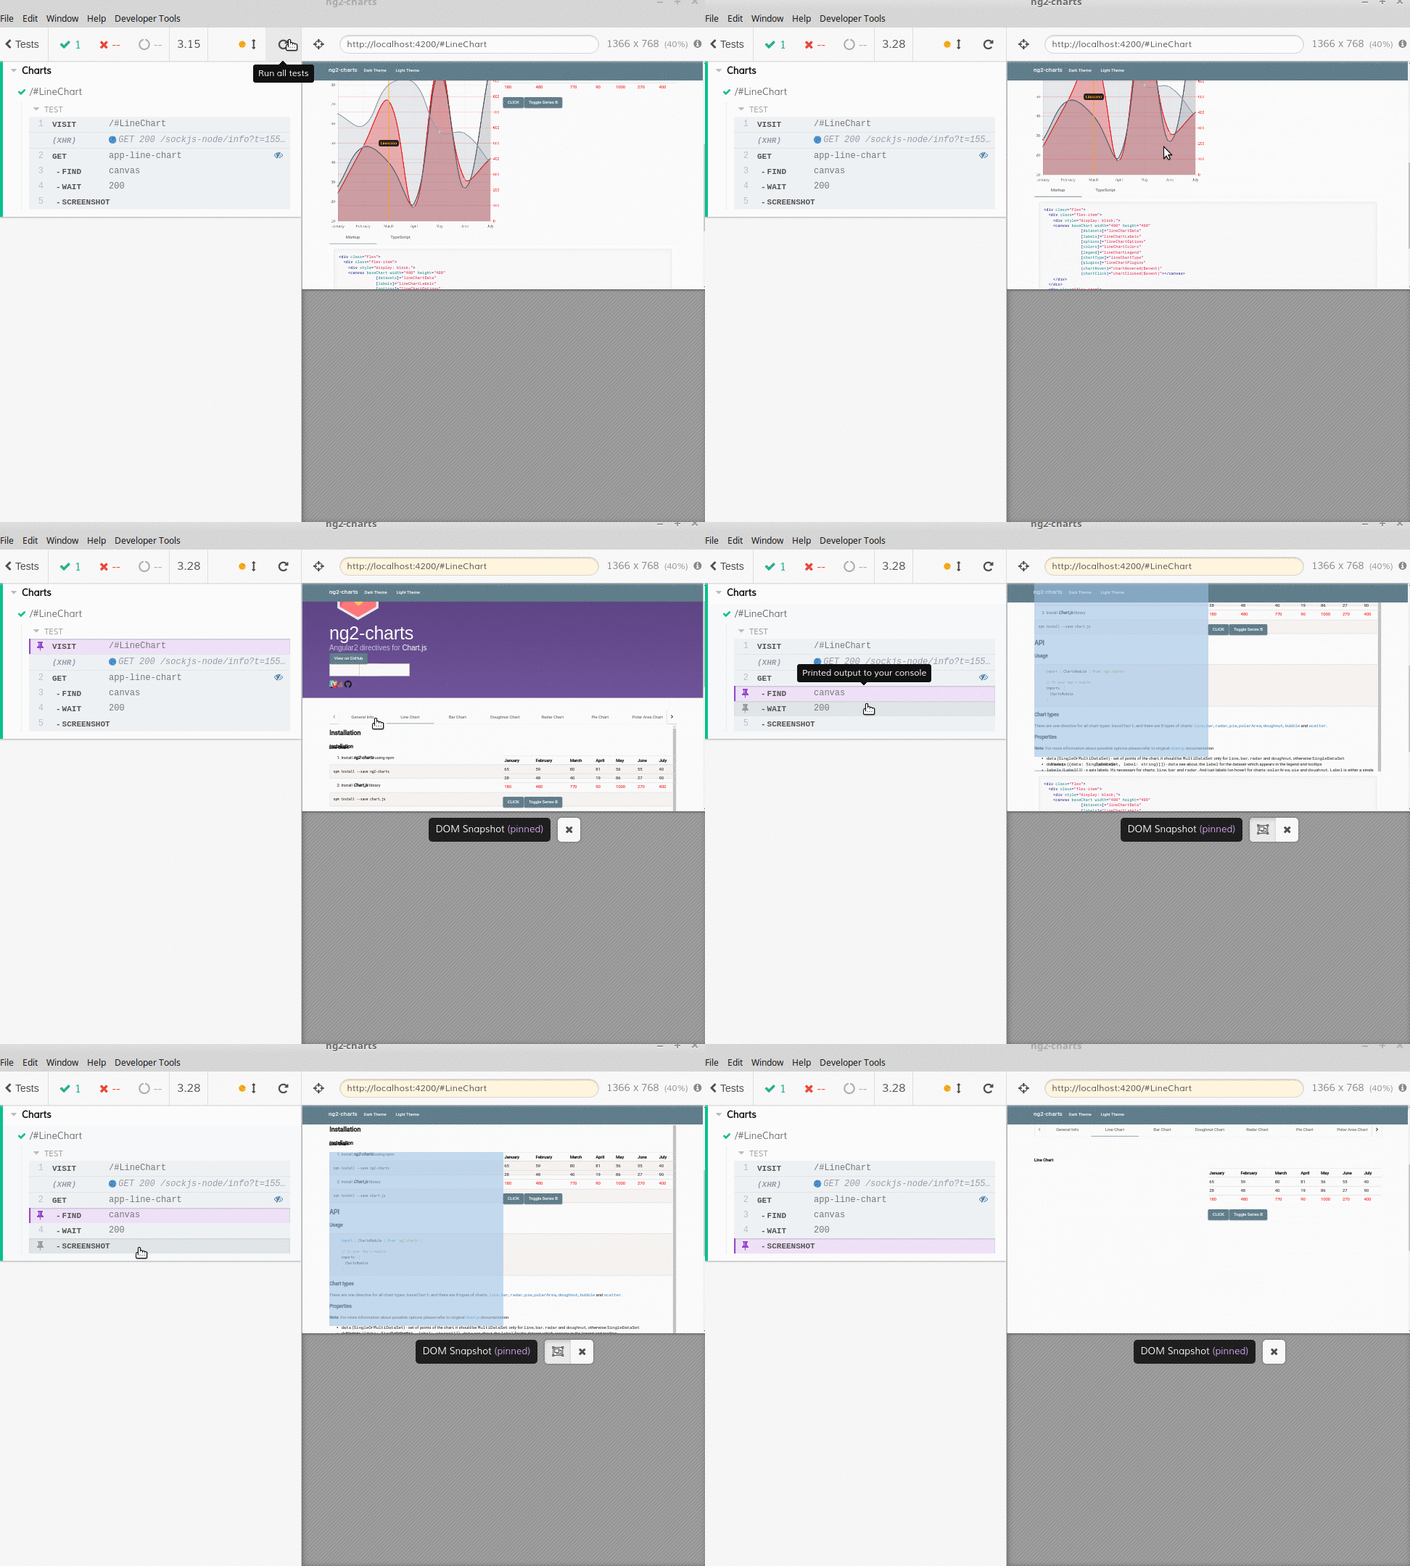
Now that the basic test which opens the page and checks two main elements to make sure their visible is ready, we can move forward. Oops, here goes the first issue. When Cypress test runs and finishes, everything seems to be okay. Our chart is visible. However, once we start going through the steps inside the Cypress browser, we’ll see space instead of our chart.

It happens because of:
Cypress takes snapshots as your tests run. To see exactly what happened at each step (according to official Cypress documentation), you have to hover over commands in the Command Log.
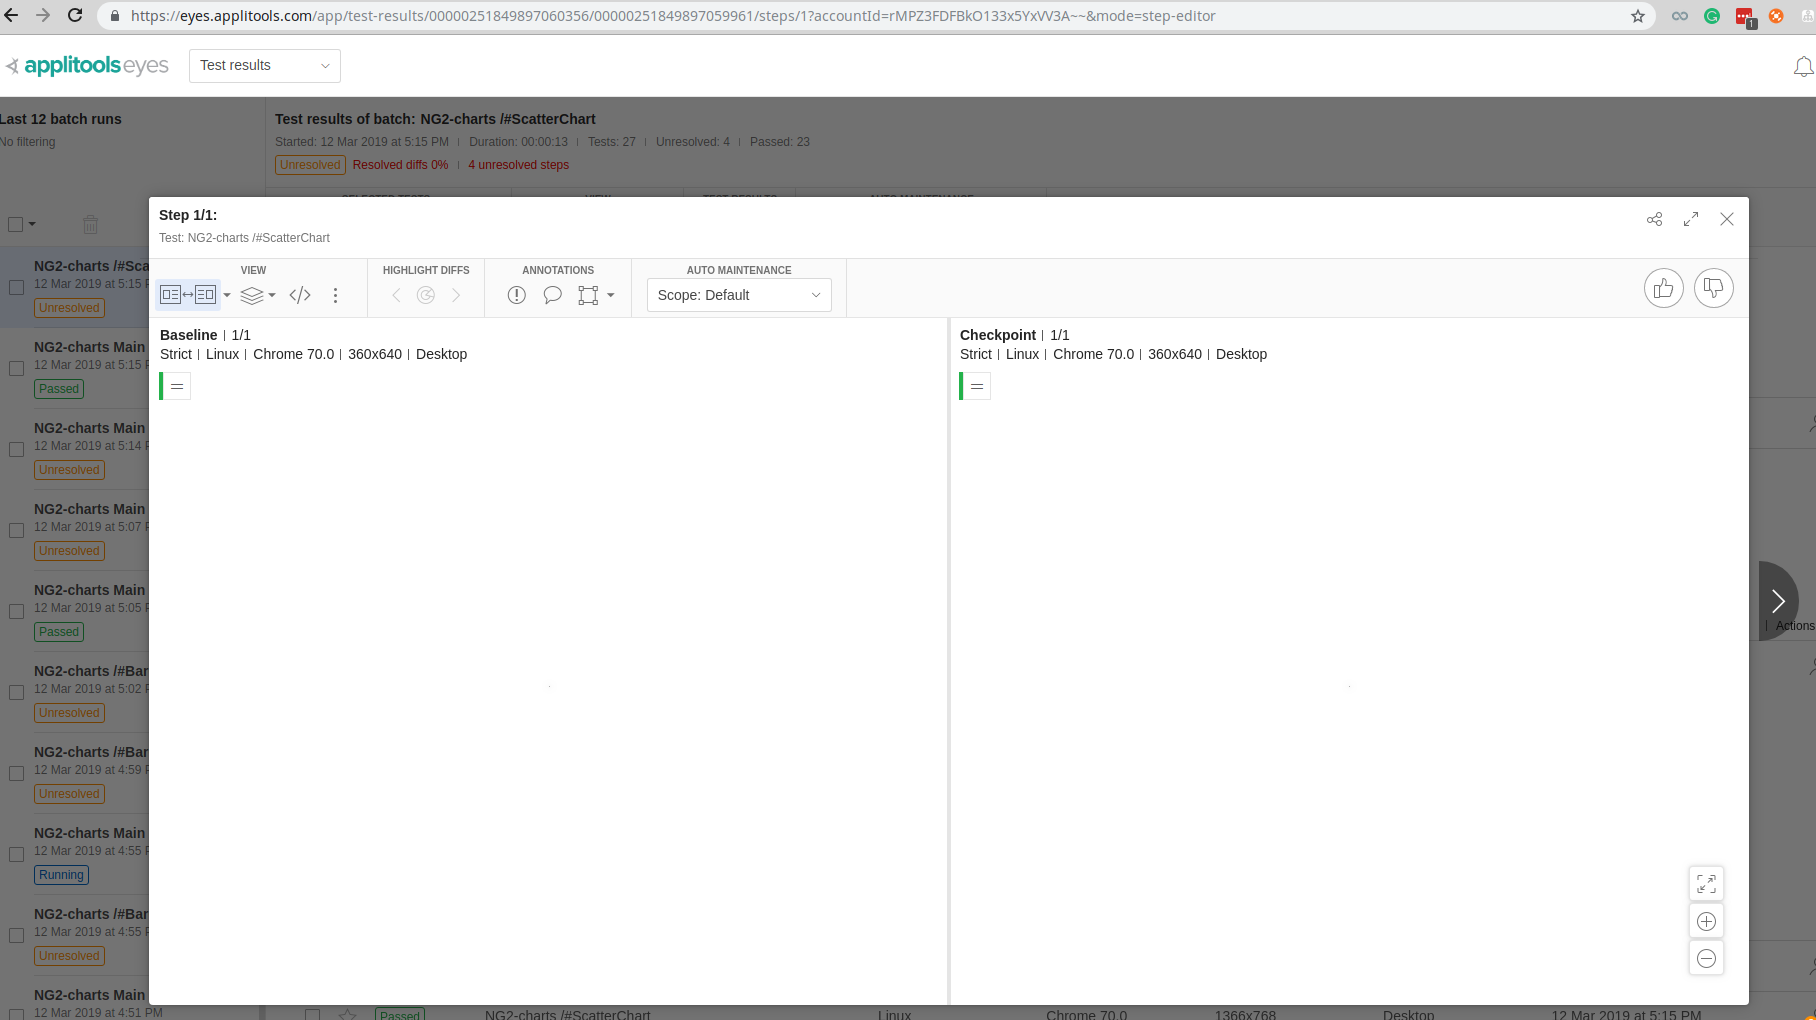
The same behavior can be seen on the Applitools screenshots:

Implementation step 2. Making real .png screenshots
Instead of snapshots, we decided to make real .png screenshots and save them for later comparison with the reference images. With Cypress it’s easy as 1-2-3:
describe('Charts', () => {
    const componentsArray = [
     {url: '/#LineChart', selector: 'app-line-chart'},
     {url: '/#BarChart', selector: 'app-bar-chart'},
     {url: '/#DoughnutChart', selector: 'app-doughnut-chart'},
     {url: '/#RadarChart', selector: 'app-radar-chart'},
     ];componentsArray.forEach(component => {
     it(`${component.url}`, () => {
      cy.visit(component.url);
      cy.get(component.selector).find('canvas').screenshot();
     });
    });
});
We want to compare screenshots of charts only - the rest of the information can be covered by other types of more "stable"UI tests. That’s why we need to find the expected <canvas> element and only then take a screenshot. By default, these screenshots will be saved to cypress/screenshots/testName/describeName — ItName.png. According to our example above, we’ll have four images with unique names.
Implementation step 3. Comparing screenshots
There are a lot of Applitools SDKs out there, and the one that suits our needs is "Applitools Eyes Javascript SDK". This library provides us with the possibility to compare real images, work with them on the Applitools Dashboard service without much of a hassle. Everything that is needed from us is to set an API key, choose an appropriate OS and hostingApp, and, of course, provide real images:
var Eyes = require('eyes.images').Eyes;
const fs = require('fs');
const urls = ["#LineChart", "#BarChart", "#DoughnutChart", "#RadarChart"];var eyes = new Eyes();
eyes.setApiKey(YourAPIKey’);
eyes.setHostingApp("Chrome");
eyes.setHostOS('MacOS latest');
async function forEachAsync(array, callback) {
    let i = 0;
    for (; i < array.length; i++) {
         await callback(array[i], i, array);
    }
}
const testResults = eyes.open("NG2-charts", "Charts comparison", {width: 1366, height: 768}).then(async function () {
    return forEachAsync(urls, async (url) => {
        const image = fs.readFileSync(`./cypress/screenshots/main-test.js/Charts -- ${url}.png`);
        await eyes.checkImage(image, url);
    });
}).then(function () {
    return eyes.close();
});
testResults.then(function (results) {
    console.log("Results: ", results);
});
That’s it! We’ve achieved our goal in no time and have stable and fully functional tests for quick demo check.
Yeah, well, but where’s the proof?
All needed settings for chosen libraries and all tests can be found in ng2-charts Valor Software repo in the appropriate PR.
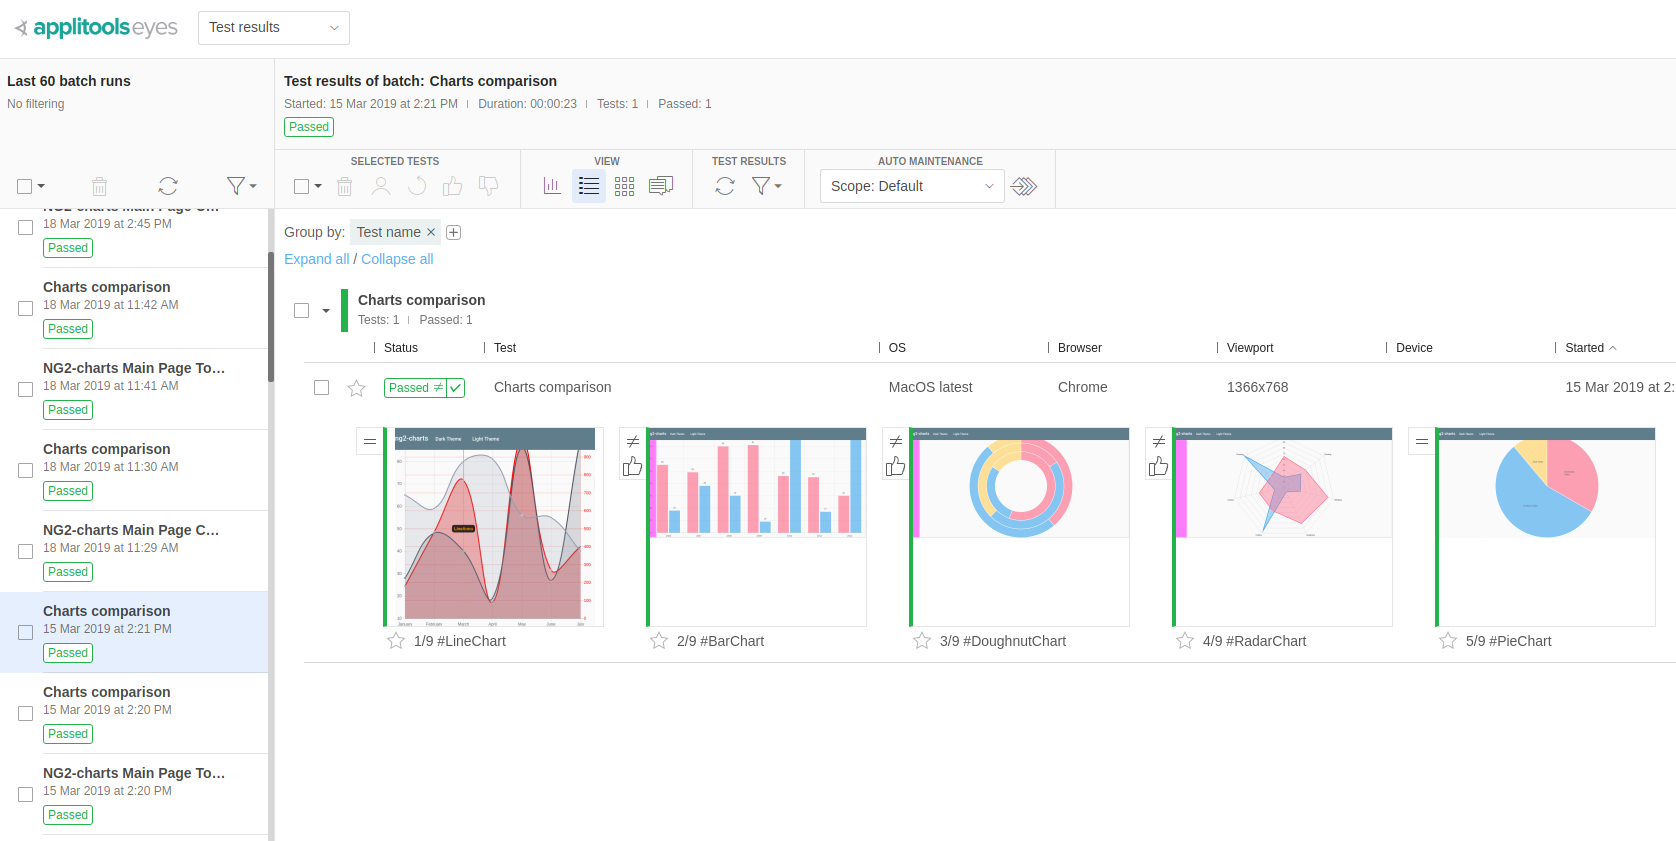
If you still don’t believe us, here’s how Applitools Dashboard looks like:

…one more thing! Travis CI log, which will be created at each CI test run, can be found on Valor Software Travis Dashboard.
Good news!
According to the Applitools development team, they currently don’t support canvas elements in the Cypress plugin. However, they will support them in the future - this will make the whole testing process of canvas elements much easier.


