NgRx needs practically no introduction in the current state of Angular applications. It allows you to manage your app’s state easily and make your UI react to the changes seamlessly. This tool is not exclusively for the web, so we can expect many NativeScript Angular applications to use it quite extensively.
Although NgRx is amazing, it still adds certain complexity to your application that is often harder to debug. For such cases, using Redux DevTools becomes indispensable in the debugging process, as it allows you to have a clear view of your state and how it changes over time. Those features, alongside time travel and custom action dispatch, make it a very powerful tool.
Many stacks have to implement their own way of integrating NgRx with Redux DevTools, for example, with Ionic, as Zack Barbuto describes in his article about remote debugging. Also, thanks to our recent efforts on WebSockets for NativeScript (find the creation story on the blog) and the chain webpack configuration added in @nativescript/webpack 5+, you can debug NgRx in NativeScript with ease. In this article I’ll tell you about our implementation details and how you can start using it right away.
Table of Contents:
Intro
Connecting Redux DevTools with NgRx for NativeScript
Overriding the way NgRx fetches the Redux extension implementation
Nativescript-ngrx-devtools plugin: features review
How to use the Plugin, steps to reproduce for debugging
Caveats
Useful Links
Connecting Redux DevTools with NgRx for NativeScript
NgRx relies on the Redux DevTools Extension to be defined in the window and implement a specific (and relatively simple) interface. Redux Remote DevTools provides an option to connect to it remotely through SocketCluster, which uses WebSockets. Thankfully, we can now use the WebSockets pluginto polyfill them.
This approach is not new, and part of our implementation can be credited to Zalmoxis and his remote debugging method. Not all node or browser libraries support NativeScript, but we can make most of them work with it. Since NS isn’t either “node” or “browser” but a combination of multiple APIs common to both, libraries that support both platforms might be usable here. SocketCluster is one of those libraries that work perfectly with NativeScript as long as we use the browser implementation. As a result, we implemented a custom way of reading the browser field spec, which is also nicely described on npm and applied the required file substitutions individually for the required libraries. This means we can now use the web version of SocketCluster freely in our implementation without fear that it’ll break existing applications.
Taking inspiration from previously mentioned implementations of the extension interface, we built our own interface focusing on reliability and small footprint. This was done by converting it fully to RxJS, adding error handling, retrying failed connections, trying to connect to multiple default debugging IPs periodically, and making it all highly configurable. The result was a robust bridge between your application and the remote Redux DevTools so that you can focus less on the details and more on developing your application faster.
Overriding the Way NgRx Fetches the Redux Extension Implementation
Once we finished writing the Redux DevTools Extension interface, we needed to provide it to NgRx. Unfortunately, NgRx gets this information from the ['__REDUX_DEVTOOLS_EXTENSION__’] window, which isn’t available in NativeScript. Polyfilling “window” is not the best approach either, as it could also lead to unintended side effects due to many libraries checking if a window exists to determine if they’re running in a browser environment or not. With a PR to NgRx, we were able to export the required symbol to override the way NgRx fetches the extension implementation.
As a side note, this change isn’t retroactive, but the plugin code has a workaround for cases when this symbol is not defined, so you can use it with older versions.
Nativescript-ngrx-devtools Plugin: Features Review
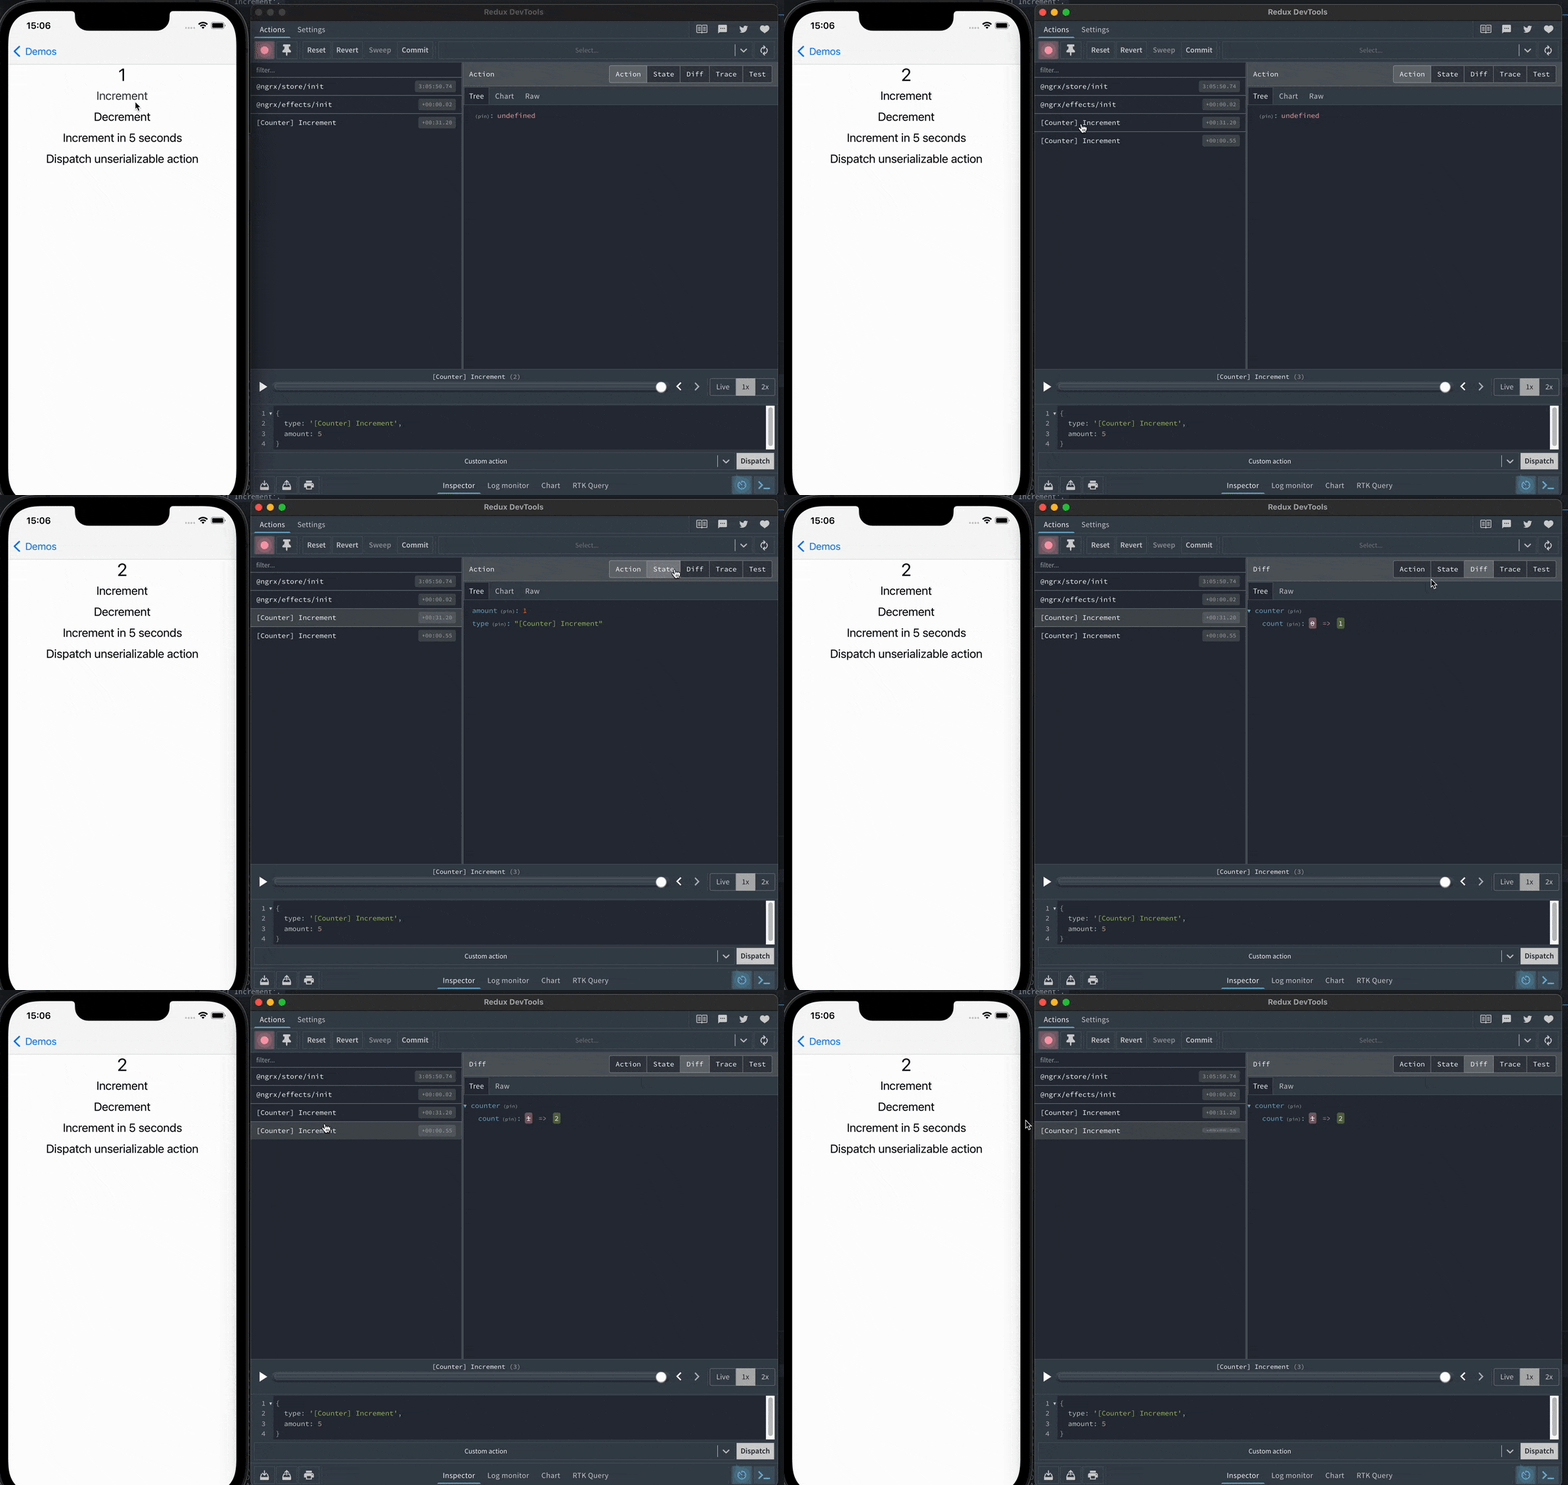
Below is the overview of key plugin features, so you get to know it better before the installation. The beginning of work with the plugin:
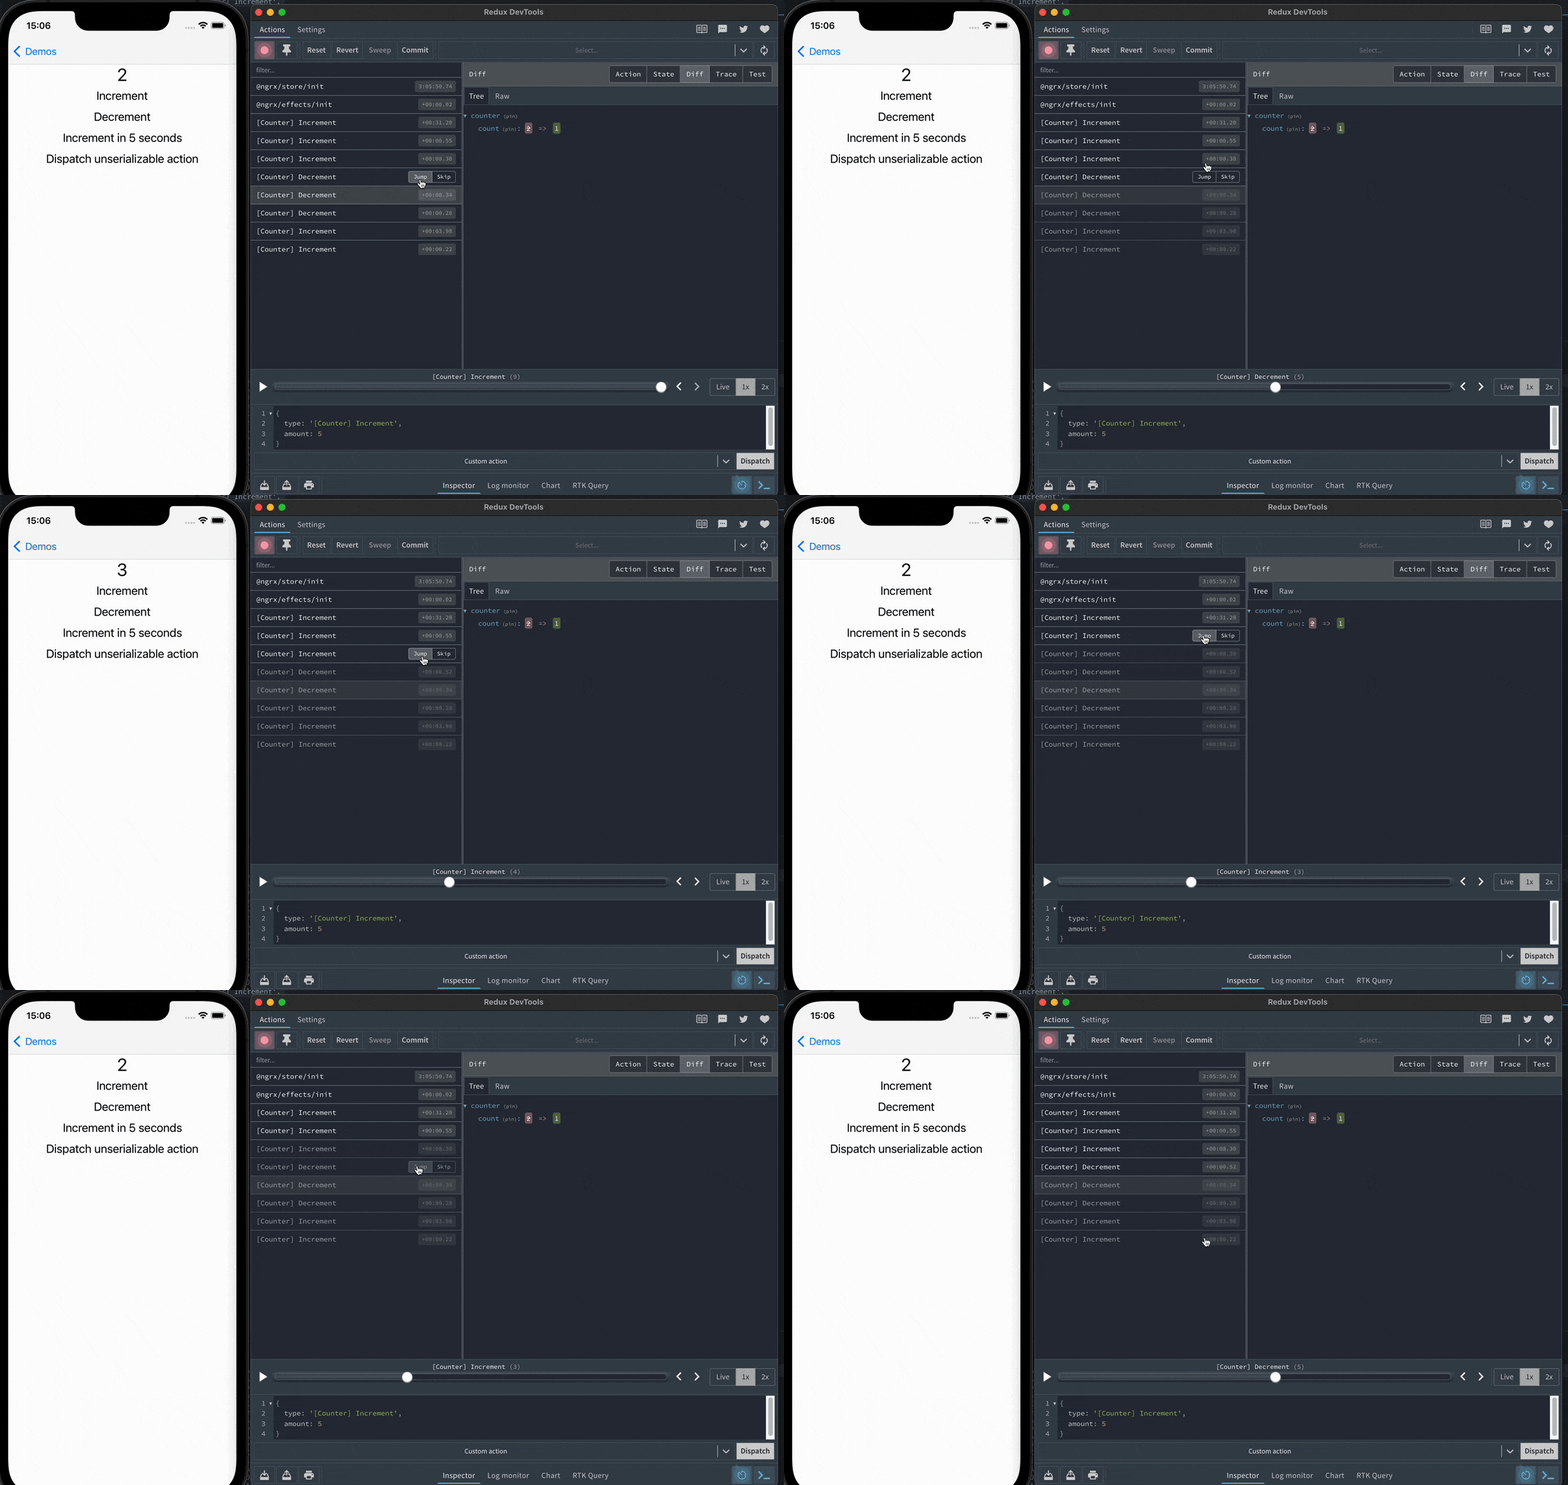
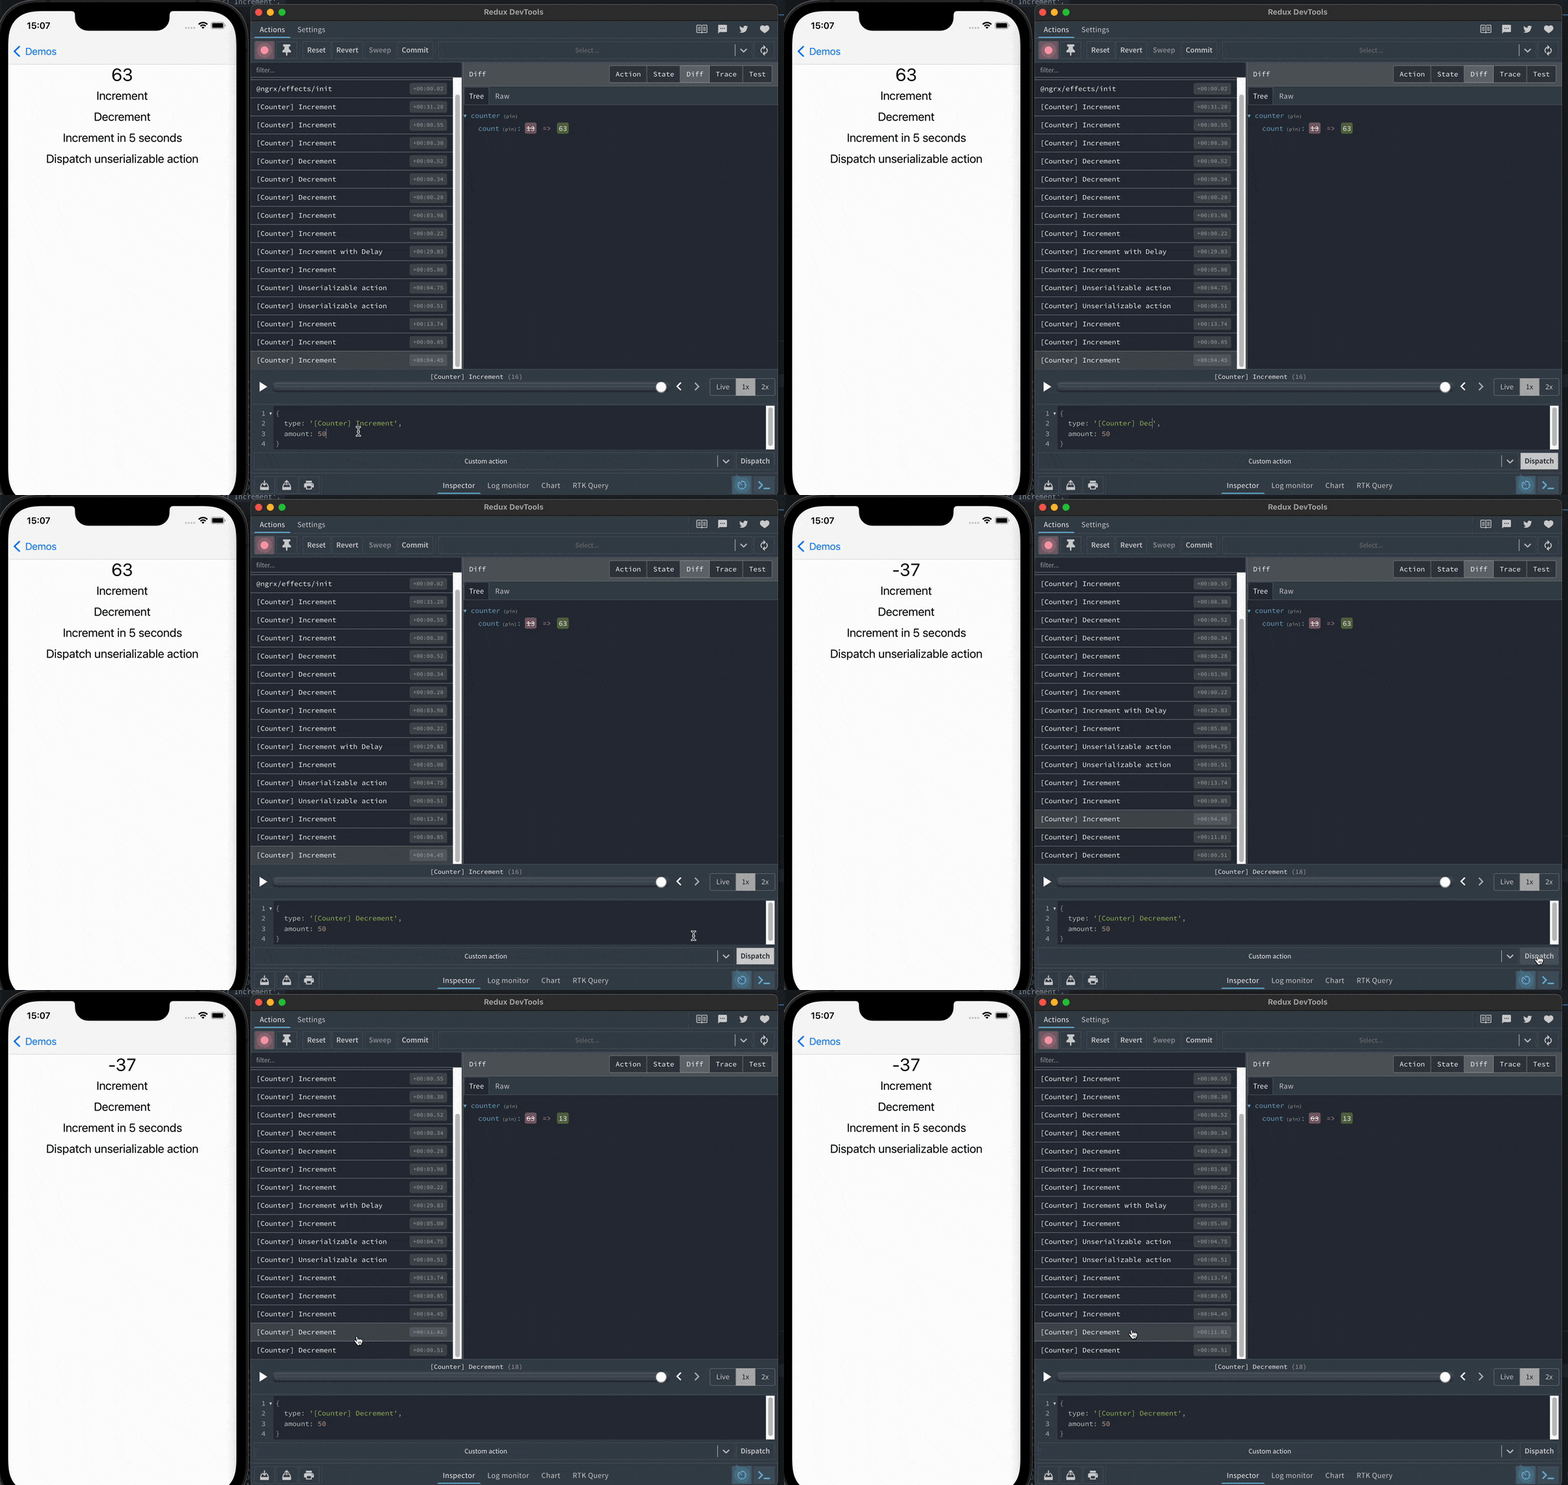
Plugin replays the state after skipping actions:
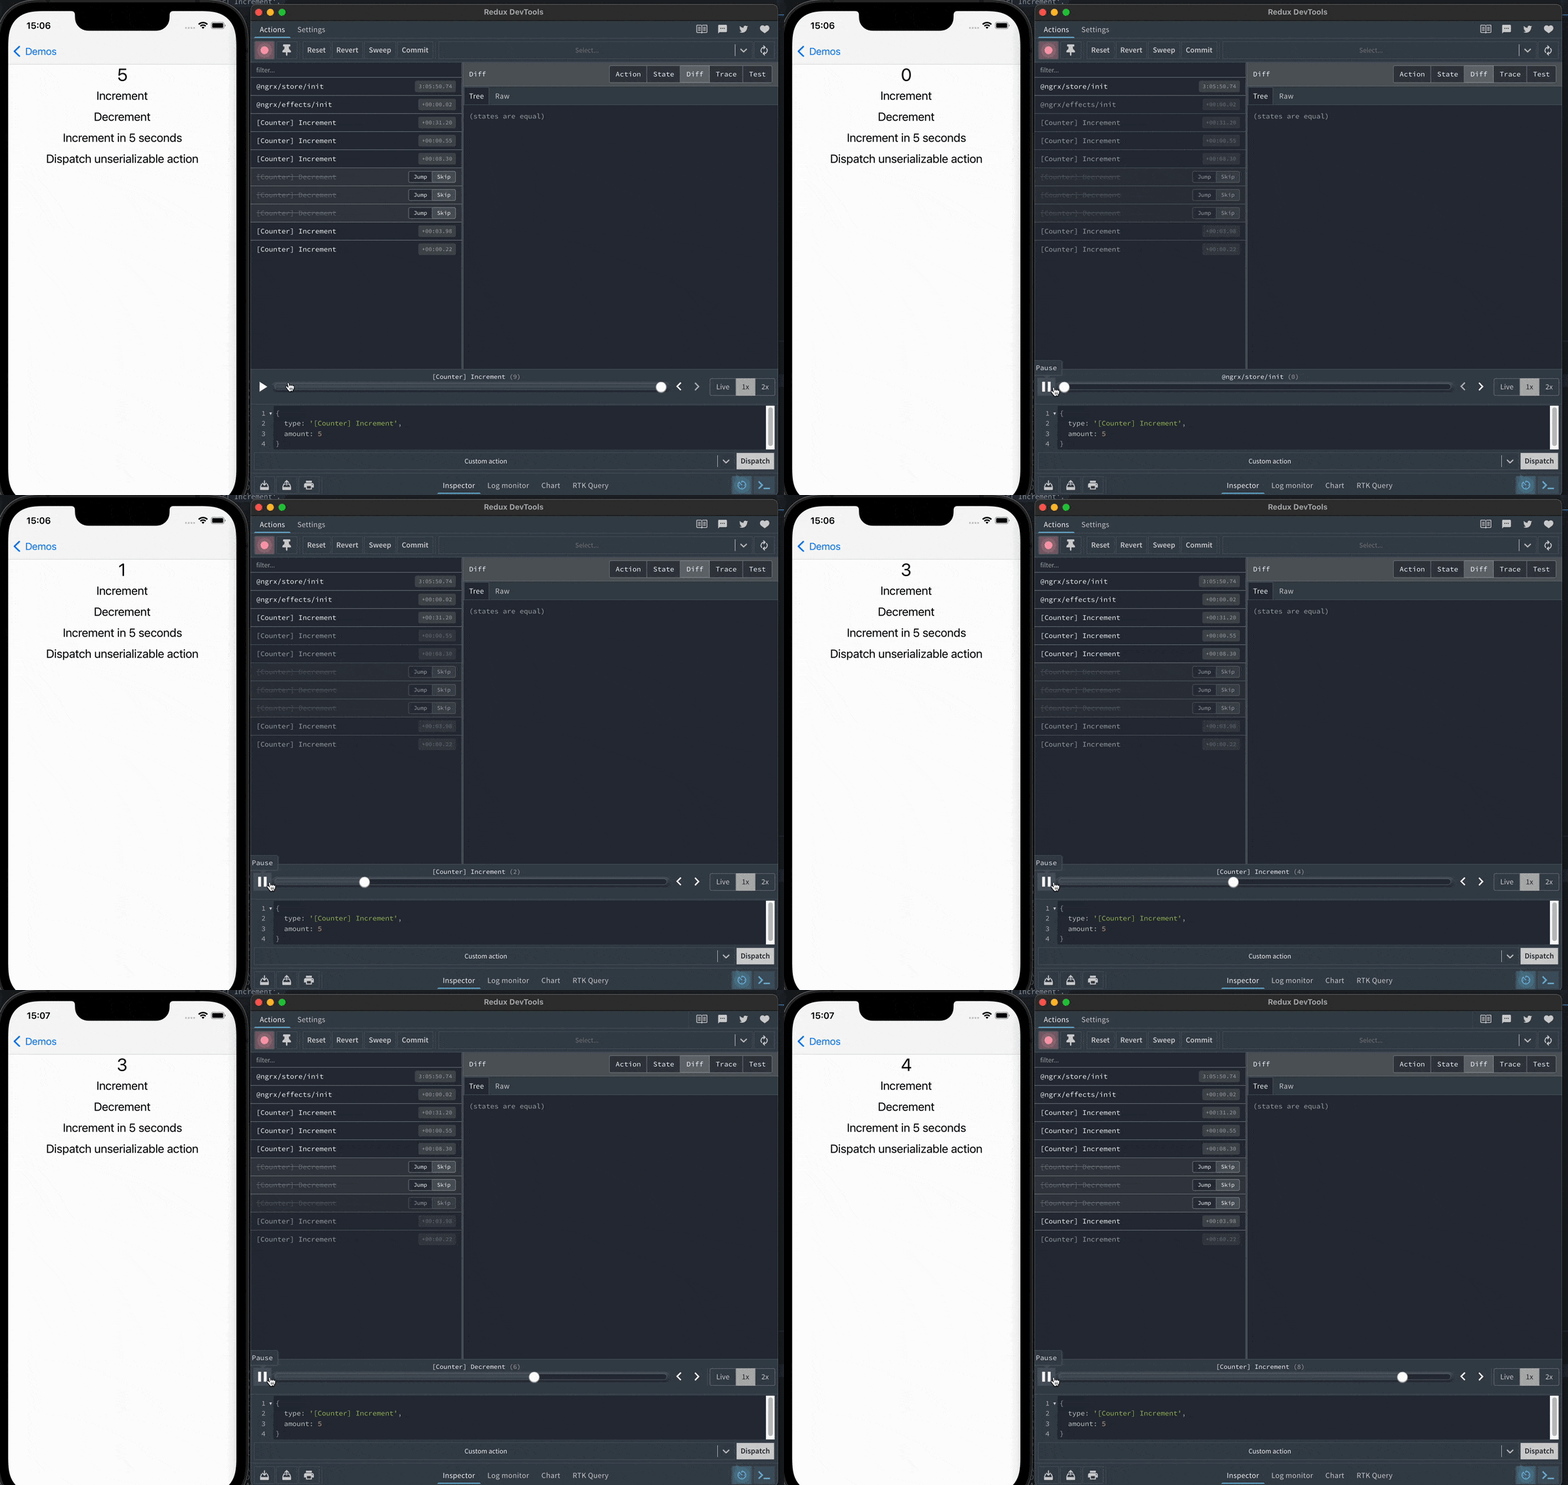
The increment with delay:

Dispatching a custom action:
How to Use the Plugin
To start using the plugin, first ensure to install both: it and our WebSockets Polyfill:
@valor/nativescript-websockets
In your polyfills.ts, ensure that websockets is properly polyfilled after nativescript’s globals:
/**
 * NativeScript Polyfills
 */
// Install @nativescript/core polyfills (XHR, setTimeout, requestAnimationFrame)
import '@nativescript/core/globals';
import '@valor/nativescript-websockets'; // add this line!
You can then import the modules of your application and start using it:
@NgModule({
    imports: [
        NativeScriptModule,
        StoreModule.forRoot(
            {
                counter: reducer,
            },
            {
                initialState: {
                    counter: initialState,
                },
            }
        ),
   ...(__DEV__ ? [ // ensure this code is tree shaken in prod
         StoreDevtoolsModule.instrument(),
         NativeScriptNgRxDevtoolsModule.forRoot()
      ] : []),

 ],
 declarations: [AppComponent],
 bootstrap: [AppComponent],
 schemas: [NO_ERRORS_SCHEMA],
})
export class AppModule {}
By default the plugin will attempt to connect to many IP addresses that NativeScript automatically detects from __NS_DEV_HOST_IPS__ on port 8000, but those can be configured in the options object in NativeScriptNgRxDevtoolsModule.forRoot(options).
After configuring our remote devtools, you can just start debugging!
Steps to Reproduce for Debugging:
Run
npm i -g @redux-devtools/cli
Then
redux-devtools --open
Open ‘Settings’ in the redux-devtools UI and ensure ‘connect local’ is checked and you’re going to use port 8000 which is default, then save those settings.
Run a NativeScript app and start debugging.
Caveats
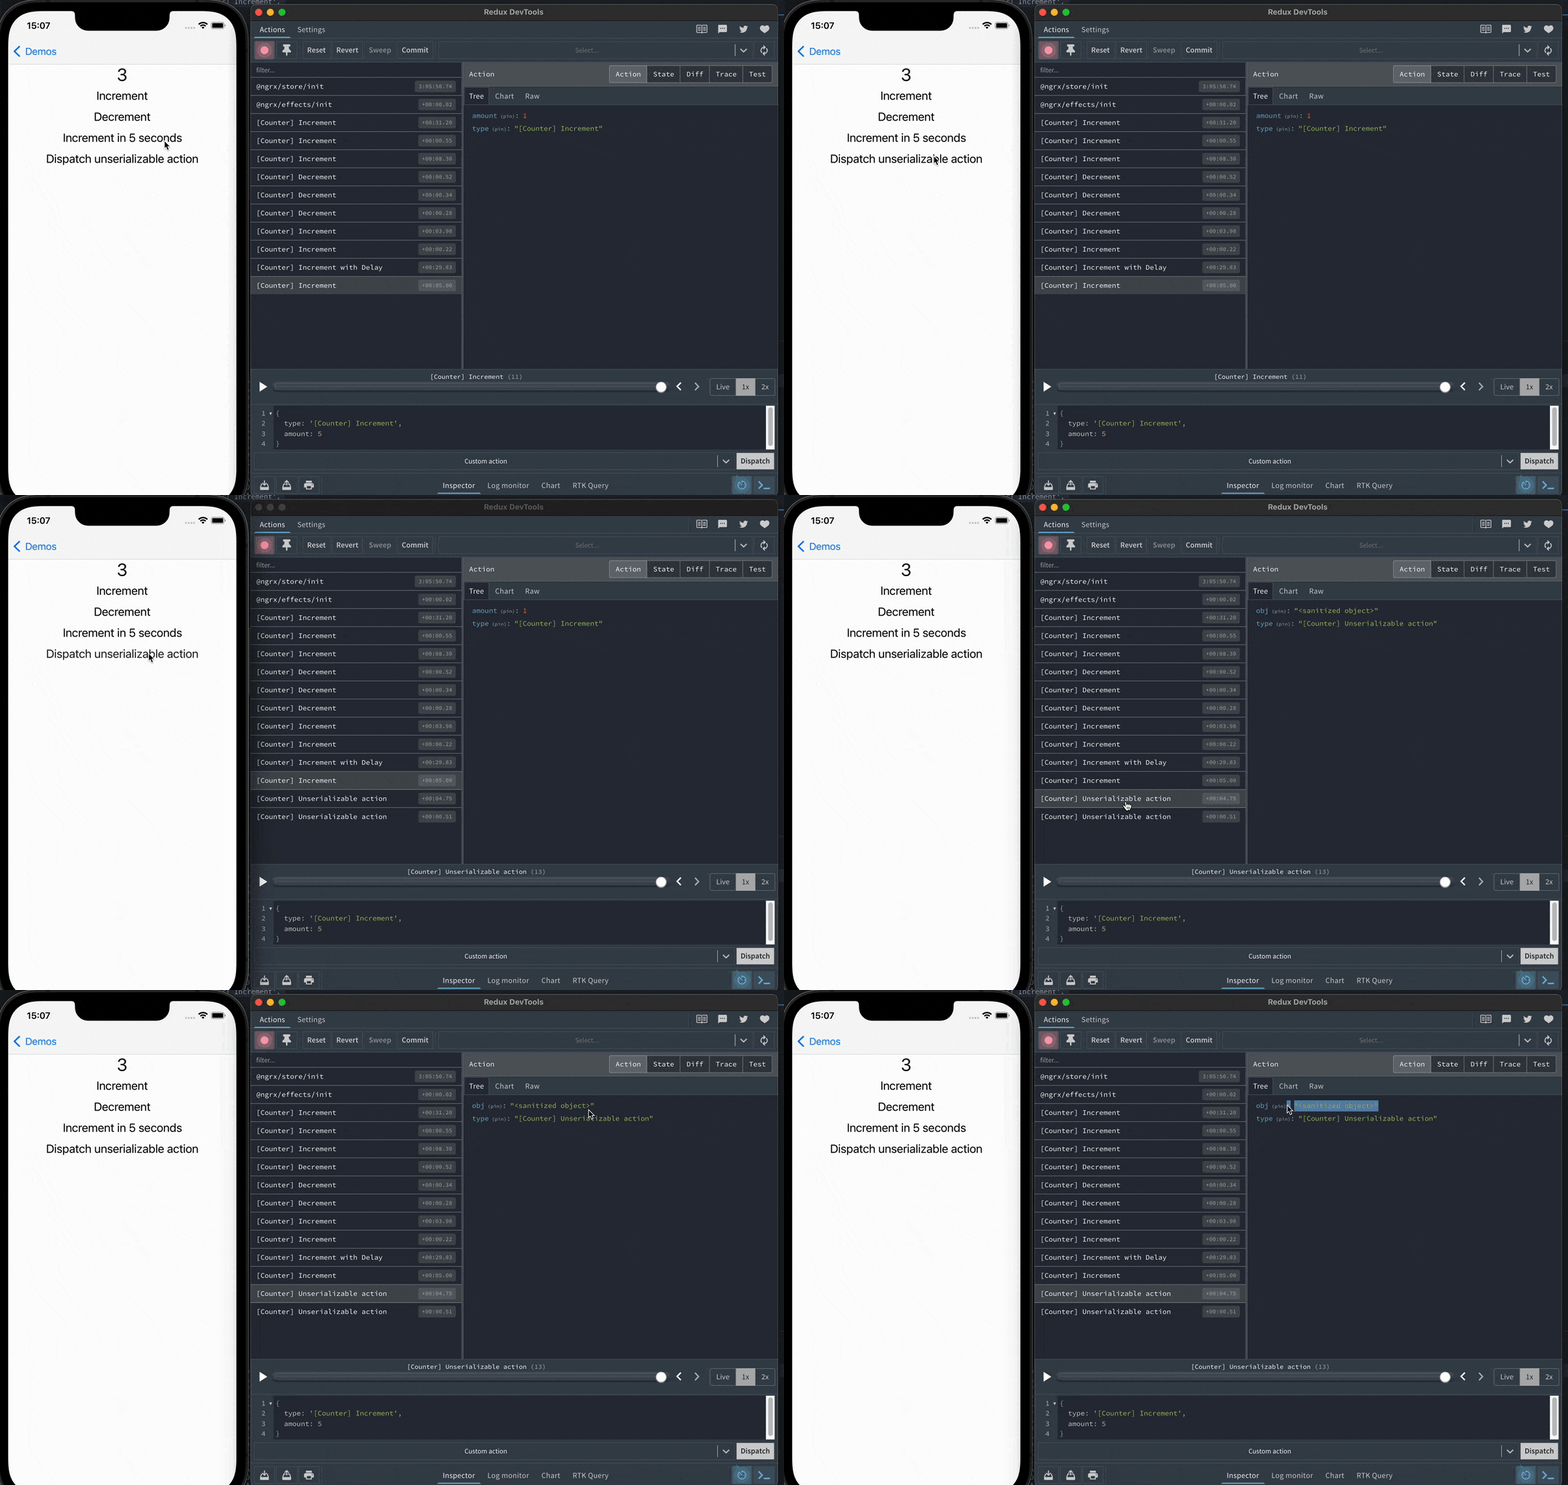
Redux DevTools already has a couple of caveats on the web, like having it crash by storing certain kinds of non-serializable objects. This also applies to NativeScript, and the fact that ignoring those caveats can also crash your app makes them even worse. Here’s an example from one of the projects we’re working on now. When testing the plugin on a large mobile app that has modals with high-definition images, we noticed that the app would crash due to a memory lack. The issue was that the action that was sent to the DevTools, contained a reference to the modal itself, so it was never garbage collected, and every time it opened, the memory would increase. Connecting to the DevTools also made the app take a performance hit as it was trying to serialize massive objects.
The solution, in this case, is to use actionSanitizer and stateSanitizer to make sure your state and actions contain only serializable data.
How it works with the plugin:
Find more on this topic from the Use sanitizers to avoid Redux Devtools crash article by Migzar Navarro and the NgRx official guide. Also worth mentioning that it’s critical to ensure you’re using webpack flags, not to bundle the DevTools in production. As they have a memory overhead you don’t want in production apps.
That’s all I wanted to tell in this article. Hope, it was useful, and you’ll enjoy using the plugin!
Useful Links
nativescript-websockets plugin
nativescript-ngrx-devtools plugin
Remote Debugging @ngrx/store with Ionic article by Zack Barbuto
Remote debugging method by Zalmoxis
Configuring npm -package-json documentation
The browser field when packaging modules for client side use spec

